
ReCover · Research / Program Design
Deep Retrofit Roadmap Energy Modelling
20
Building Archetypes
80
Retrofit Scenarios
4
Atlantic Provinces
50–80%
Energy Reduction Range
01 · The Challenge
Deep retrofits need real numbers
Canada’s existing building stock is one of the largest sources of greenhouse gas emissions in the country. Deep energy retrofits — renovations that reduce a building’s energy consumption by 50% or more — are essential to meeting national climate targets. But designing effective deep retrofit programs requires answering hard questions: Which buildings benefit most? What upgrade strategies work for different building types? How do regional differences in climate and grid emissions change the equation?
02 · Scope & Approach
20 buildings, 4 scenarios, 4 provinces
We modelled 20 archetype buildings — ten Part 3 (commercial and multi-unit residential) and ten Part 9 (residential) — selected to represent the diversity of Atlantic Canada’s building stock. Each archetype was modelled in its baseline condition, then upgraded to meet four distinct retrofit scenarios.
Part 3 Buildings
Small and large MURBs, commercial offices, warehouse, library, retail strip, and a school — spanning wood-framed, steel, and concrete construction from the 1970s to 1990s.
Part 9 Buildings
Bungalows, two-storeys, urban rowhouses, duplexes, a mini home, a small MURB, and a split-level — covering the range of housing types, vintages, and heating systems found across the region.
4 Retrofit Scenarios
From a baseline 50% energy reduction up to 80% for Part 3, and scenario-specific targets for Part 9 including TEDI, net-zero-ready, code-minimum, and non-intrusive pathways.
4 Regional Climates
Every model was run using weather data from Halifax, Charlottetown, Fredericton, and St. John’s — producing results across all four Atlantic provinces.
Part 3 modelling was performed using eQUEST. Part 9 modelling used HOT2000 via Volta SNAP for the initial Halifax models and NRCan’s Housing Technology Assessment Platform (HTAP) to extend results across regions.
03 · The Findings
What the modelling revealed
The central finding is that achieving 50% or greater energy reduction is technically feasible for every archetype — but the required strategies vary significantly depending on building type, baseline condition, and region.
FINDING 1
Upgrade strategies are not one-size-fits-all
Heating dominates energy use across all archetypes, making heating load reduction and system efficiency improvements essential in every case. But the path to get there differs:
- Wood-framed Part 3 buildings could reach the 50% target primarily through envelope upgrades, thanks to lower thermal bridging and higher baseline insulation.
- Other Part 3 construction types required envelope, ventilation, and mechanical improvements together to reach the same target.
- Buildings with non-electric heating saw greater returns from the same upgrades, since replacing 65–80% efficient boilers with heat pumps yields larger savings than replacing electric resistance heating.
- Most Part 9 homes could achieve 50% energy reduction without any building envelope work — through mechanical system upgrades and electrification alone.
FINDING 2
Regional grid emissions change the carbon story
ReCover’s cross-provincial scope revealed a finding that single-province programs would miss entirely: deep energy savings don’t guarantee deep carbon savings. Deep energy reductions were achieved consistently in all four provinces, but in Nova Scotia only 64% of scenarios that cut energy by 50% also cut GHG by 50% — because NS’s grid emits roughly 35 times the CO₂e per unit of electricity of Newfoundland’s near-zero-emission hydro grid. This holds for any retrofit depth: a large MURB cutting energy by ~70% sees GHG reductions of roughly 33% in NS versus nearly 100% in NL.
The starkest illustration is a 1990s oil-heated home with a single intervention: replacing the oil furnace and oil-fired hot water with a heat pump and heat-pump water heater. Energy savings are consistent — 47–56% across all four provinces — but first-year GHG savings range from 12% in Nova Scotia to 94% in Newfoundland.

Chart: Same Retrofit, Different Carbon Outcomes — First-year GHG savings, 1990s oil-heated home, heat pump + heat-pump water heater only (Scenario 4). NS 12% vs NL 94%.
FINDING 3
Envelope upgrades drive comfort, not just energy
Scenario 4 — the “non-intrusive” path focused on mechanical upgrades and electrification — can achieve 50%+ energy savings for most homes. But it barely improves the building’s thermal envelope. Scenarios 1 and 2, which include envelope upgrades, reduce thermal energy demand by more than 80%. Scenario 4 leaves it essentially unchanged — walls stay cold, drafts persist, and the comfort benefits of a deep retrofit are largely missed.
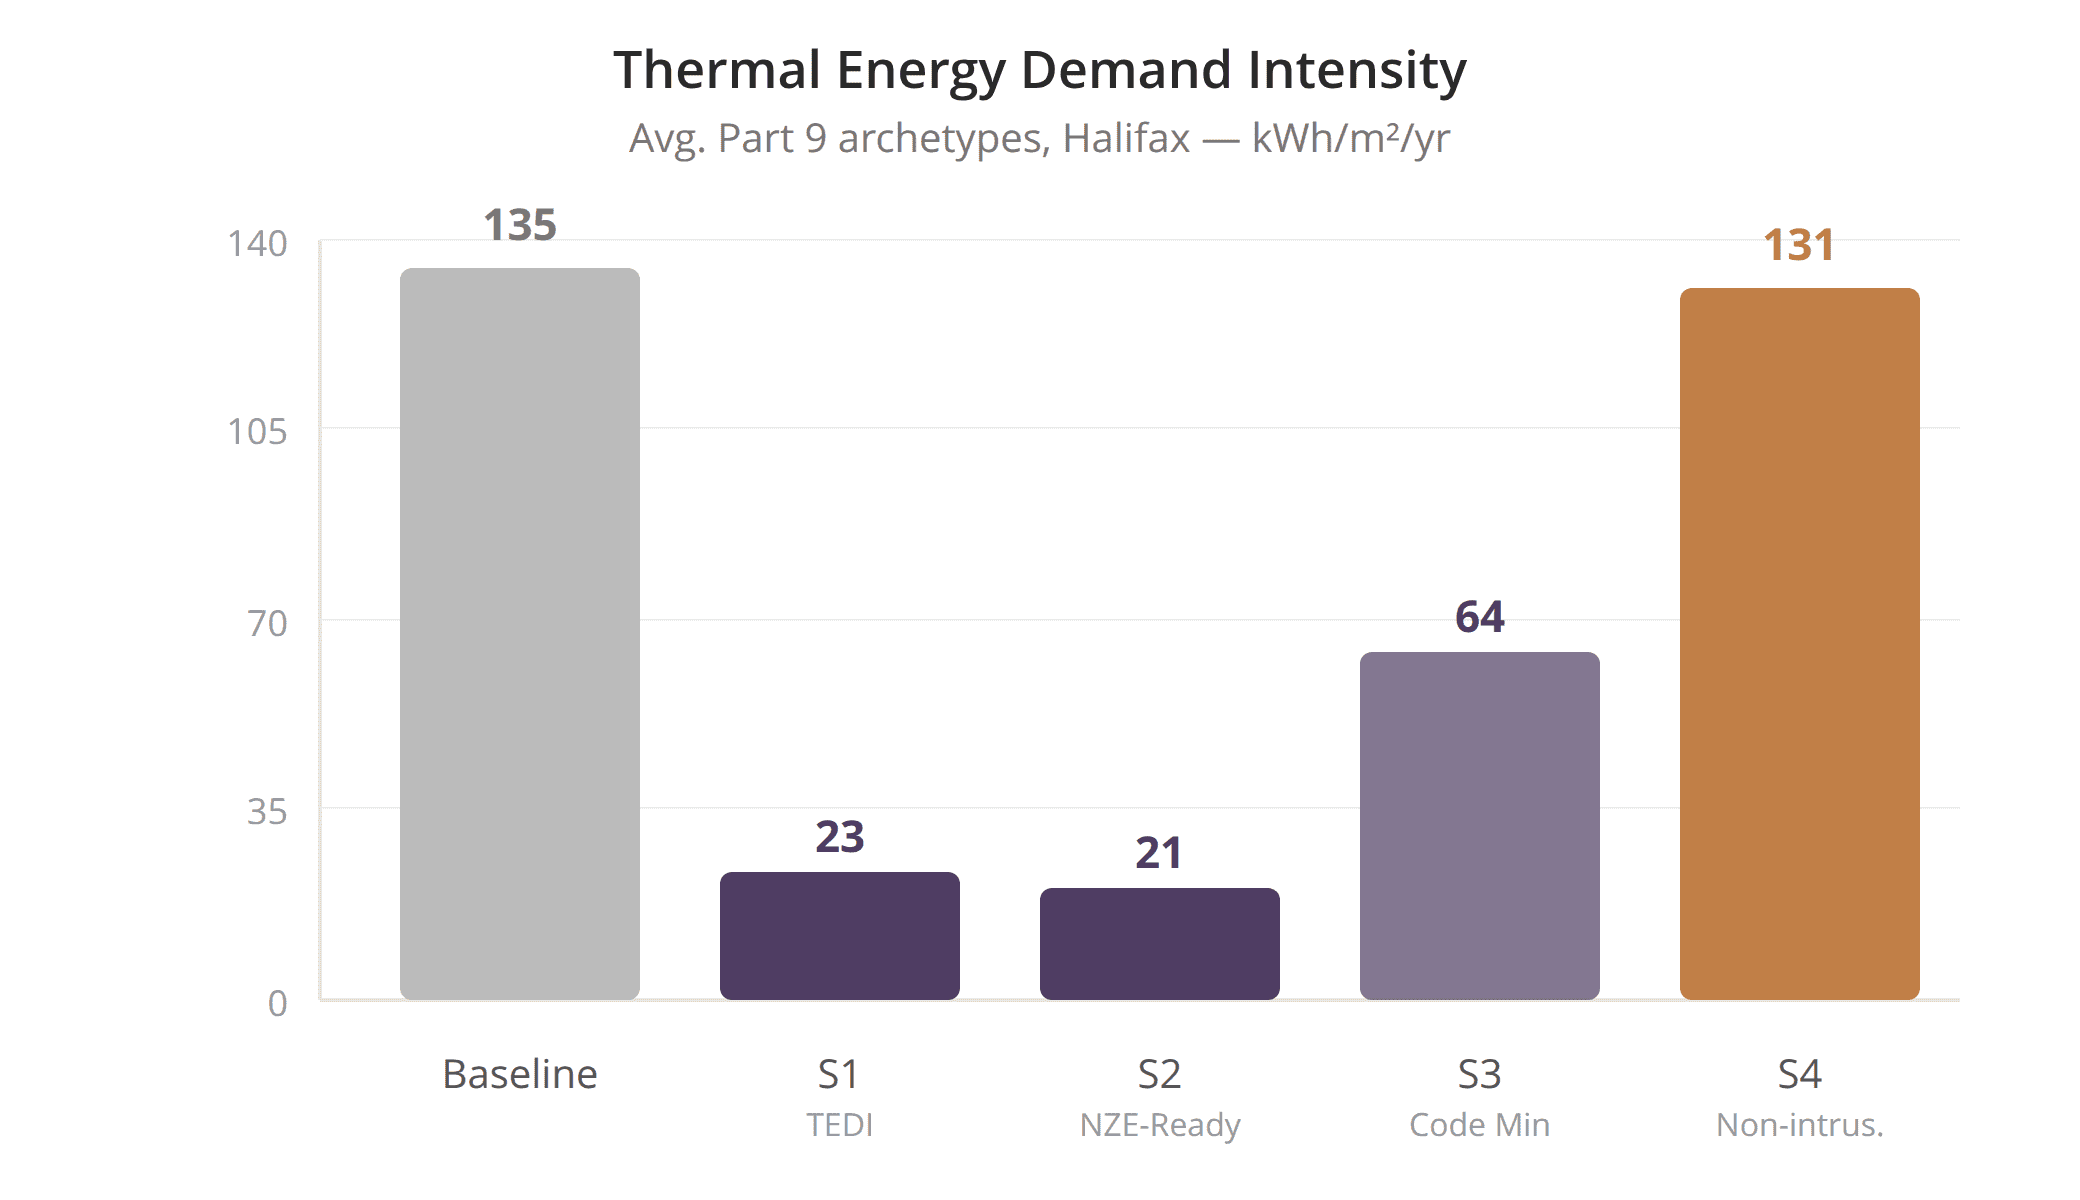
Chart: Thermal Energy Demand Intensity — Avg. Part 9 archetypes, Halifax (kWh/m²/yr). Baseline 135, S1 (TEDI) 23, S2 (NZE-Ready) 21, S3 (Code Min) 64, S4 (Non-intrusive) 131.
FINDING 4
Program design choices have major consequences
The four scenarios we modelled are analogous to different program eligibility structures. The results show that how a program defines “deep retrofit” determines which buildings can participate, the total savings potential, the balance of activity across provinces, and the types of non-energy impacts that arise.
As the chart shows, deep energy savings are achievable everywhere — but uniform, energy-only targets produce very uneven carbon outcomes across provinces. A program that sets its threshold on energy alone buys far less carbon in Nova Scotia than the identical program in Newfoundland.
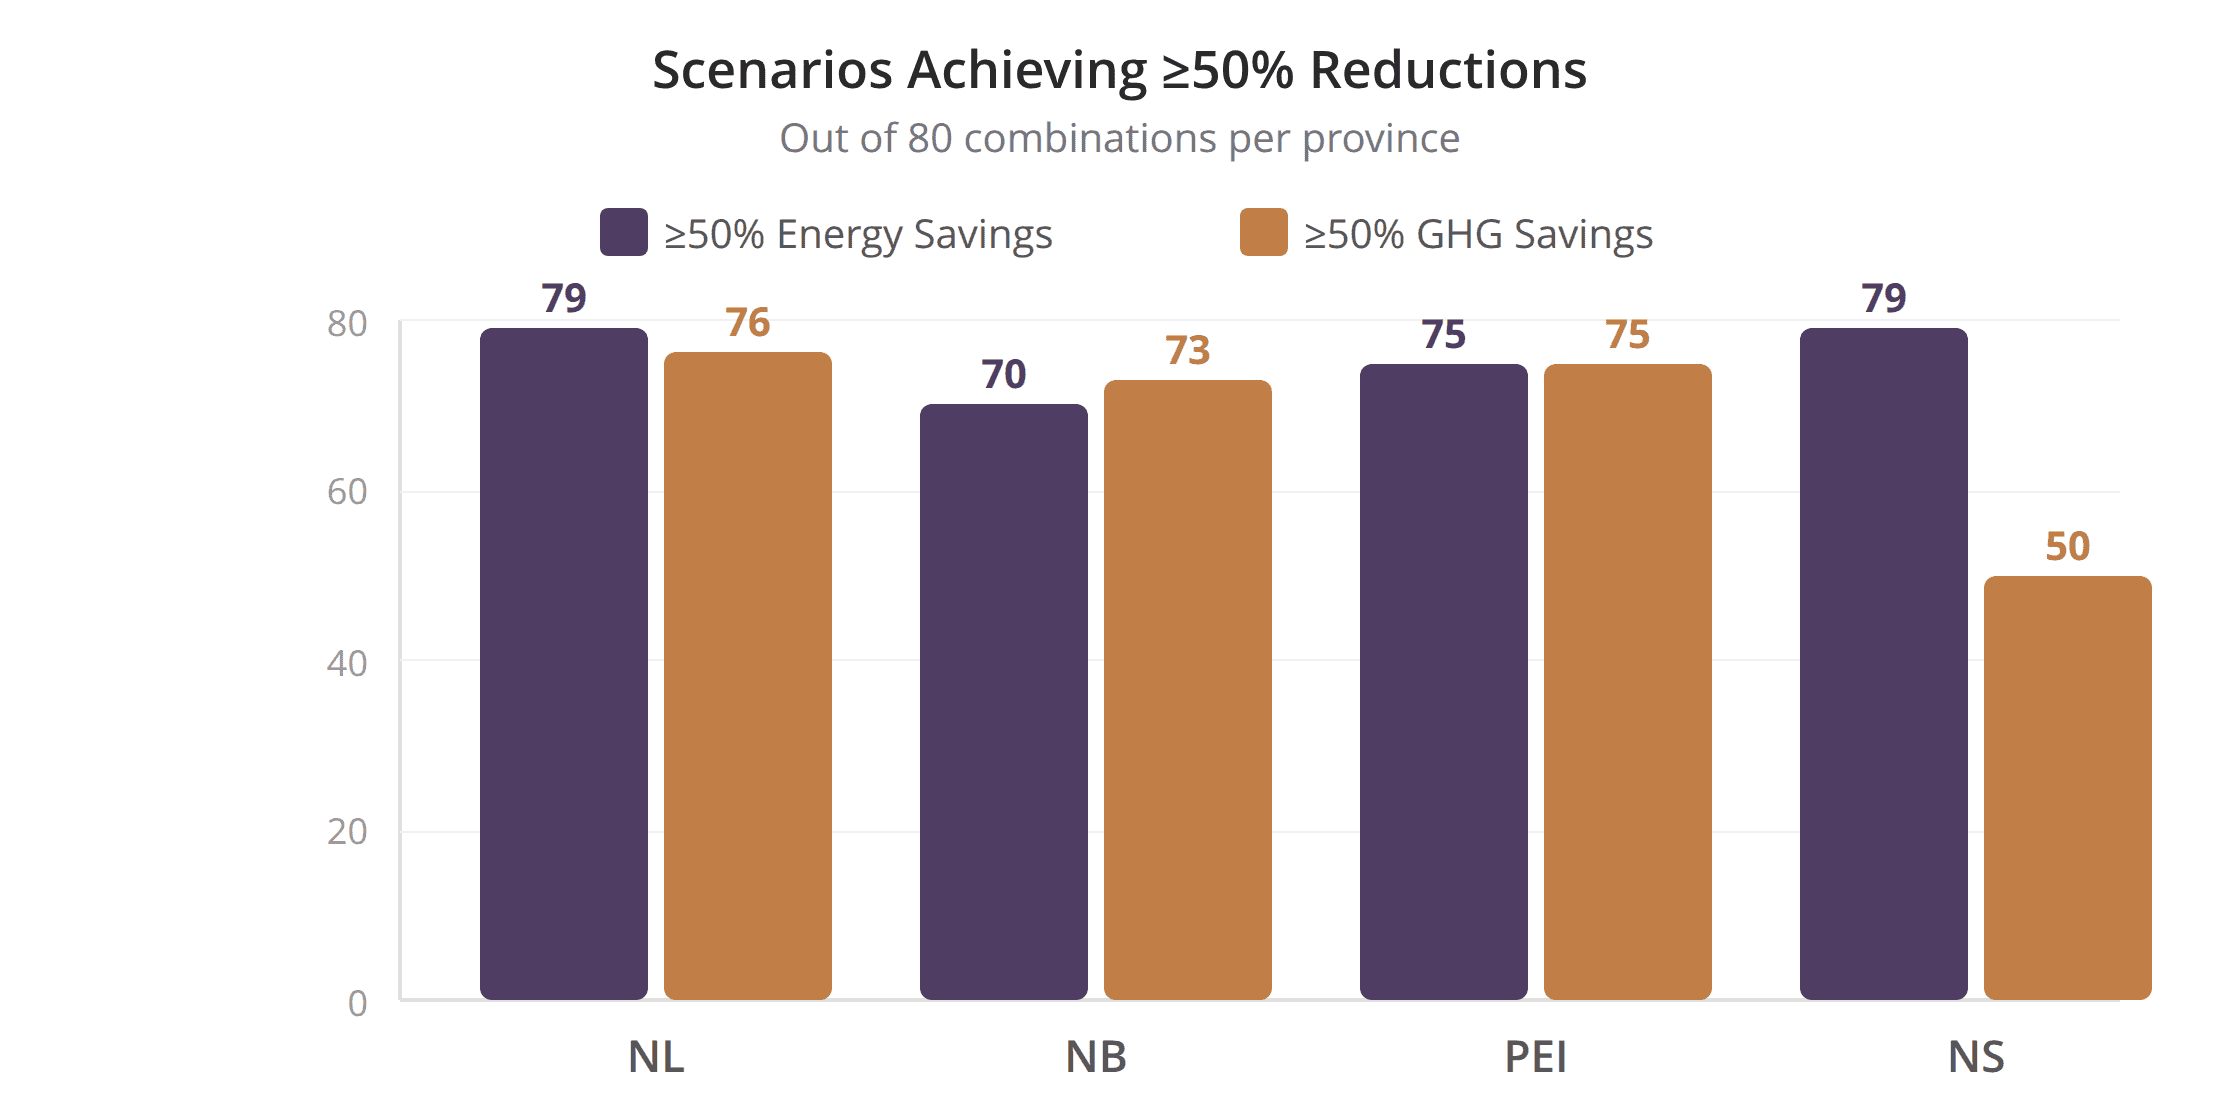
Chart: Scenarios Achieving ≥50% Reductions (out of 80 per province). ≥50% Energy vs ≥50% GHG — NL 79/76, NB 70/73, PEI 75/75, NS 79/50.
04 · The Process
Six checkpoints from kickoff to knowledge transfer
1
Kick-off
Scope, archetypes & scenario design
2
Sample Models
1 Part 3 + 1 Part 9 for ReCover review
3
Full Modelling
All 20 archetypes × 4 scenarios
4
QA Review
Cross-check all model outputs
5
Regional Runs
4 provincial weather files
6
Reporting
Final report & knowledge transfer
BEA led Part 9 modelling and project management. IEP led Part 3 modelling. Both teams collaborated on archetype selection, scenario definitions, upgrade strategies, and the final report. ReCover provided direction throughout the project and integrated the modelling into the Atlantic Canada Deep Retrofit Roadmap.
05 · The Outcome
From model outputs to published Roadmaps
The modelling results provide the quantitative backbone for ReCover’s Retrofit Roadmaps — data-driven evidence that deep retrofits are achievable across Atlantic Canada’s diverse building stock, with clear guidance on which strategies work where and why.
Beyond the numbers, the study produced five strategic recommendations for ReCover as it establishes itself as the deep retrofit authority in Atlantic Canada:
- Build a strategic stakeholder coalition
- Maintain flexibility at the project level while tracking aggregate outcomes
- Design eligibility criteria deliberately, using modelling to test impacts and equity
- Systematically assess non-energy impacts for every building
- Align program delivery with building owners’ own objectives
The full article was created by Baseline Energy Analytics (BEA) and first published on their website. BEA partnered with ReCover on the Roadmap.